The melting of the ice sheets produces unique patterns of sea-level change across the globe, with sea level rising more in some areas than others. Scientists call such patterns ‘sea-level fingerprints’. Being able to fingerprint how sea-level changes due to each ice sheet is crucial to producing accurate sea-level projections. But before we can model the sea-level fingerprints associated with future ice-sheet melt, we must first demonstrate that the models can correctly predict the sea-level response to past ice-sheet melt. Far-flung mid-Pacific ocean islands provide just the information needed to do this.

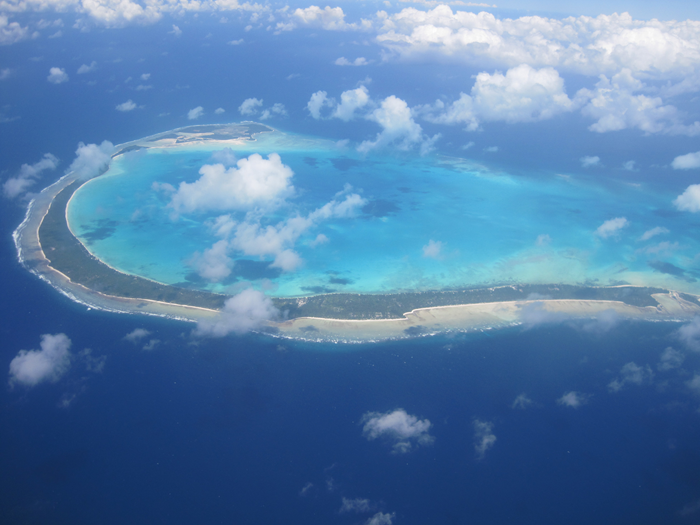
Onotoa Island is part of the Gilbert Islands, which were part of this study (Source: Edvac/CC BY-SA 3.0)
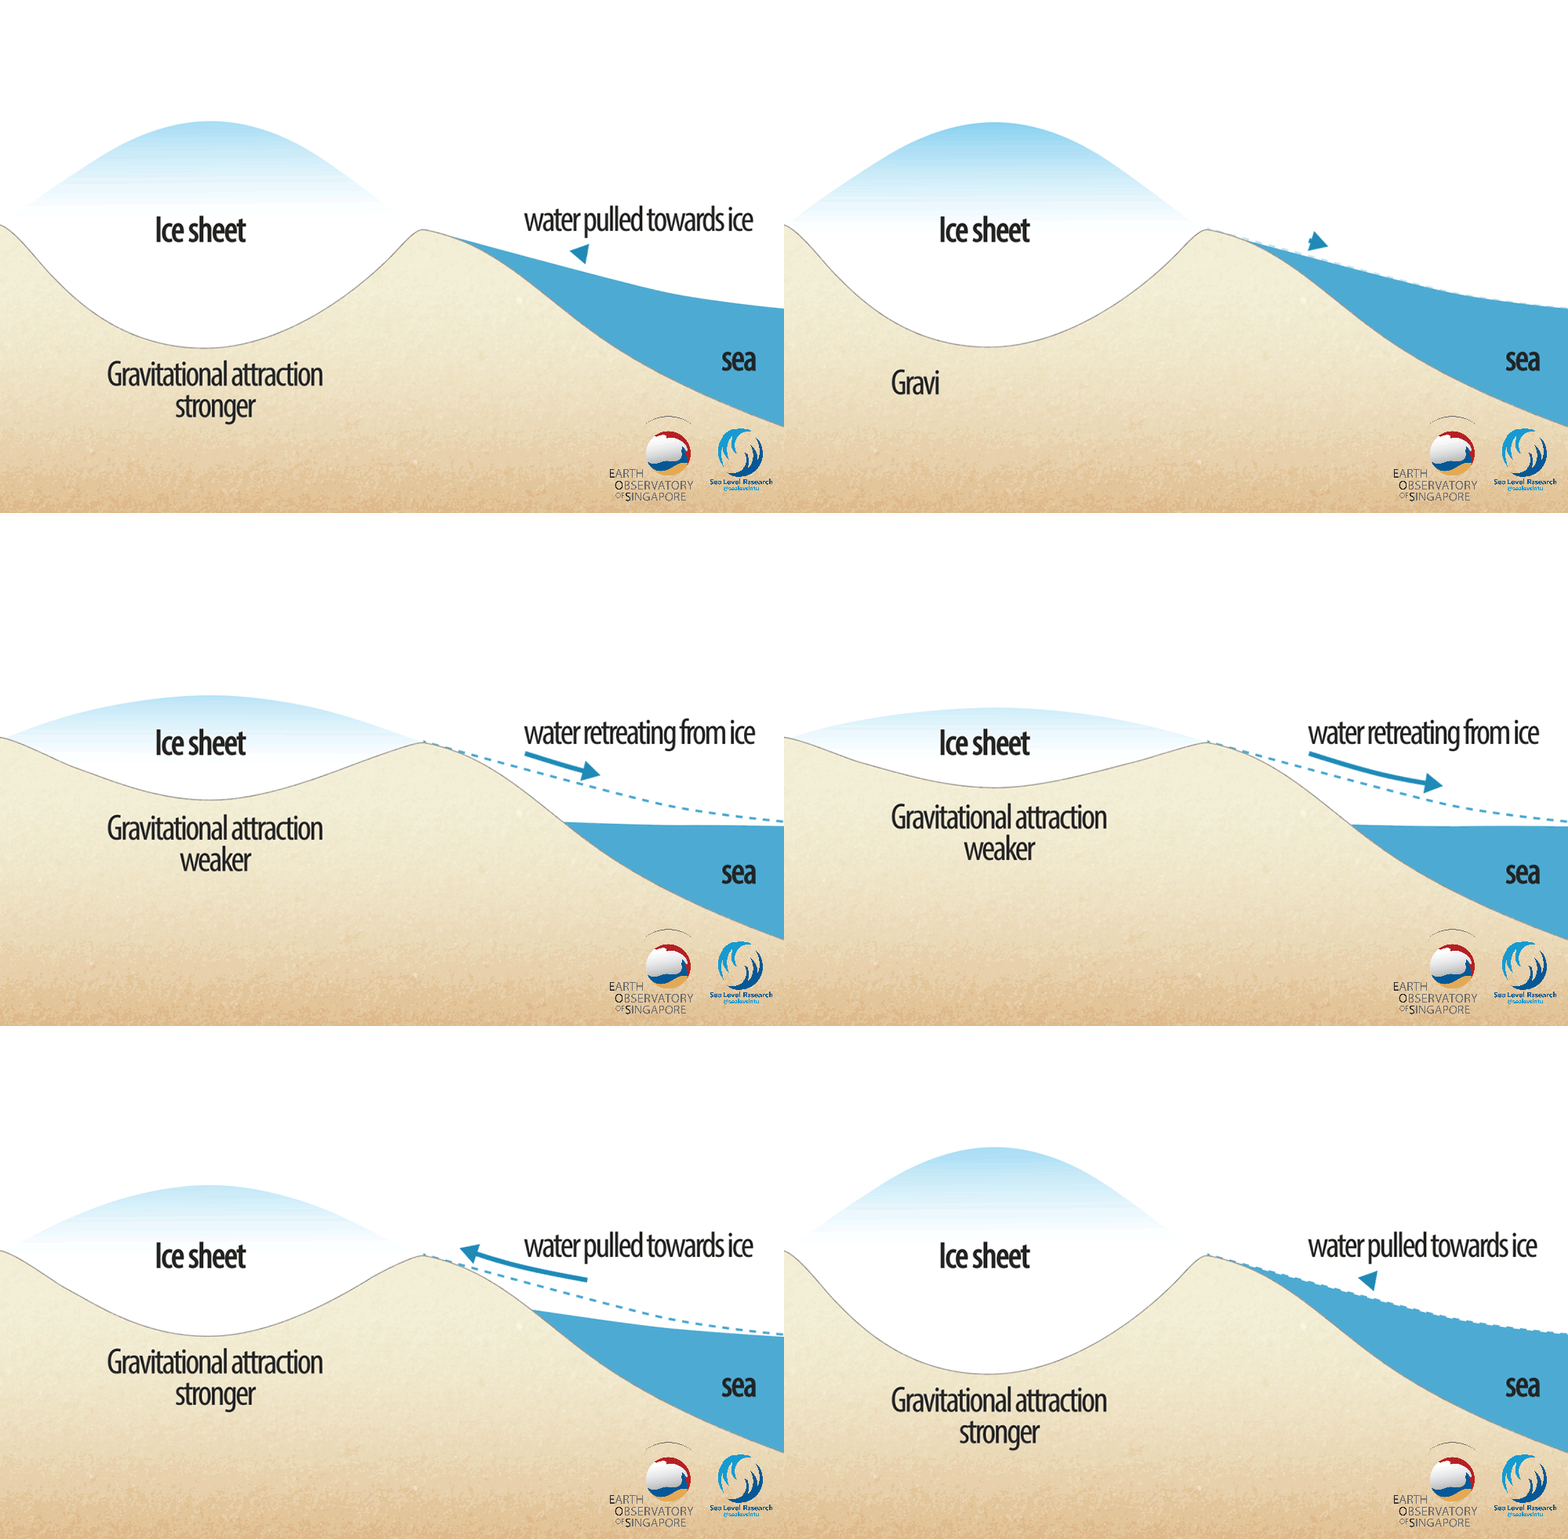
For years, researchers have turned to mid-Pacific ocean islands to understand how sea levels change in response to the melting of ice sheets. Unlike pouring water in a glass, sea level does not rise uniformly everywhere when meltwater is added to the oceans. In fact, sea level falls in places that were formerly covered by ice. Most of the meltwater flows towards faraway places, such as Southeast Asia and mid-Pacific islands, which experience a disproportionately larger amount of sea-level rise. As a result, mid-Pacific islands are distant recorders of what happens to the ice sheets in higher latitudes.

Animated schematic showing how sea level flows away from the ice sheet towards faraway places when an ice sheet melts (Source: Earth Observatory of Singapore)
In a recent study published in Quaternary Science Reviews, we compiled a database of sea levels over the past ~10,000 years from five island groups in the mid-Pacific. Some of this data had previously been used to validate models of the sea-level response to ice-sheet melt. However, research that produces data of past sea levels has evolved over the years. Some data were produced as early as 1975, in a time when the internet did not exist, and when scientific methods were different from today. In our database, we standardised the data to use the same methods where possible, or ensured that we fully accounted for all uncertainties in the data. Only then can the data be used reliably to validate models.
Over three years, I peered through more than 60 scientific publications and extracted a total of 614 data points across five island groups in the mid-Pacific. Each data point tells us what sea level was for a given time and place. Some publications were easily accessible via a quick search on the internet, others less so. Two of the books about the pioneering sea-level research in the mid-Pacific were available only in hardcopy; they had to be shipped from Australia and finally got delivered more than a year later. While most of the papers were in English, I translated a handful of French papers related to the French Polynesian region and found interesting nuances in the translation. For example, the term ‘atoll’ means “couronne récifale” in French, which directly translates to “crown reef”. This made a lot of sense in retrospect – atolls do tend to be shaped like a crown. At times, we had to reach out to the authors of the existing studies to make sure that we were obtaining all the information we needed to produce an accurate and fair assessment of the data. An important aspect of the database was to ensure that all data were standardised, keeping only data points that fulfilled some set criteria.

Ms Tan Fang Yi holding books with key data, that she managed to obtain from Australia to help build the database (Source: Fang Yi Tan/Earth Observatory of Singapore)
While challenging at times, it was amusing reading the papers that were published tens of years apart. Older papers were written almost poetically and some recollected myths from the mid-Pacific islands. One myth was about how the islands were ‘fished up’ or ‘thrown down’ by demigods, which could represent submarine volcanoes erupting, or land moving up and down after big earthquakes.
As I discovered while reading through old papers and books, some of the earliest studies in the mid-Pacific were driven by an international collaboration of scientists starting in the 1970s. Our work contributes to a continued and global effort to improve our understanding of far-field sea levels in the mid-Pacific – a topic studied by the ‘Geographic variability of HOLocene relative sea level group (HOLSEA)’.
Our database paves the way for future data collection and model validation
Our database provides new insights into the use of existing data for model validation. Models that predict the sea-level response to the melting of the ice sheets generally comprise two broad components that interact with each other: a model of the deglaciation history of past ice sheets since ~21,000 years ago, and a model of the Earth structure that determines how the Earth reshapes itself when meltwater is transferred from land into the oceans. Previous studies used the existing data – before we standardised them and included them into our database - to validate specific deglaciation histories. With our standardised and quality-controlled database, we show that there are more possibilities for the deglaciation histories than previously suggested.

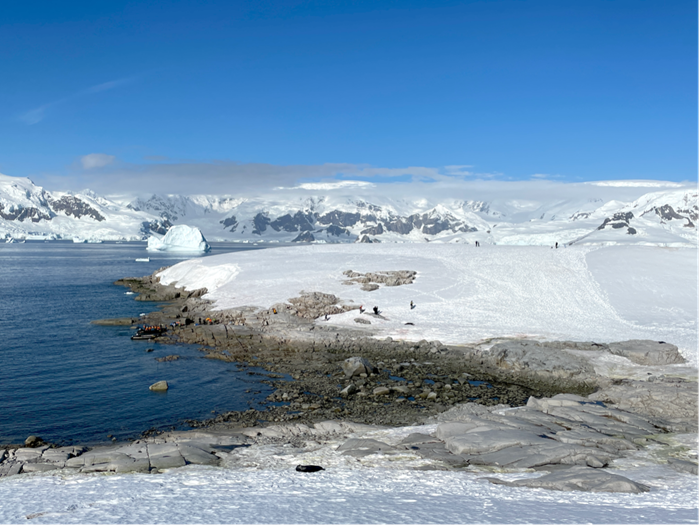
Today, the Antarctic Ice sheet is the largest source of uncertainty in future sea levels and has the potential to raise global sea levels by many metres. Understanding how sea levels respond to ice-sheet melt is therefore crucial in preparation for future sea-level change. (Source: Fangyi Tan/ Earth Observatory of Singapore)
We also developed a new ranking system that categorise data as high or low quality, which will guide modellers in their model validation.
Our database offers a starting point to improve our understanding of sea-level changes in the mid-Pacific. After carefully reviewing each data point and weeding out data that are less reliable, we showed that all regions are lacking data in the older period prior to about 6,000 years ago. Gilbert Islands in particular lacks data throughout the past 10,000 years to present.
We hope that our database can guide future data collection efforts. A more complete record of sea levels over the past 10,000 years is needed to gain insight into the deglaciation histories of past ice sheets and to validate models. This will help us understand how sea levels have changed in the past and how they might change in the future. A better understanding of past sea levels will also provide context for studies of how humans adapted to these changes, such as how they might have migrated across the mid-Pacific islands.
Ms Tan Fang Yi is a PhD student at the NTU Asian School of the Environment, working with the EOS Sea Level Research group.